The Myths And Realities Of Advertising Algorithms
"Data-Driven Thinking" is written by members of the media community and contains fresh ideas on the digital revolution in media.
Today’s column is written by Jay Friedman, chief operating officer at Goodway Group.
I thought the days when companies promised awesome algorithms without offering any details were over. Companies like AppNexus or DataXu are transparent with their algorithms, which are used to optimize digital media. Yet I still hear others pitch “black box” algorithm cure-alls.
While it’d be great to put this debate to bed, it’s not that easy. While researching this piece, for example, I found that for every data scientist who tells you the right way to solve how to identify the best way to develop a performance algorithm, three others claim the equation is wrong and propose something different.
To shed light on the algorithm debate, I’ve laid out a few different perspectives below that are meant to be common sense. I’m not a data scientist, but you shouldn’t have to be one to understand what you’re being sold. This is for you, the media buyer, the client-side marketing executive trying to make sense of big data, and the media sales rep who wants the complex broken down into something simpler.
A Primer On Sample Size
For starters, it’s important to understand that any algorithm must have enough data about a given combination of variables to decide its value. For instance, you wouldn't take a poll of just one person and project the national presidential election because the sample size would be too small. In a race with at least two presidential candidates, you’d need a sample size of 1,067 according to this sample size calculator, if you assumed there are 180 million registered voters and wanted a margin of error of 3% and a 95% confidence level. This is sufficient because the top candidate may be favored by 51%, and the other 46%, with some unknowns. With the 3% margin of error, even if this poll were taken hundreds of times, the candidate with 51% would receive between 48% and 54% of votes 95% of the time. Margin of error works on a bell curve like this, which assumes a 95% confidence level:
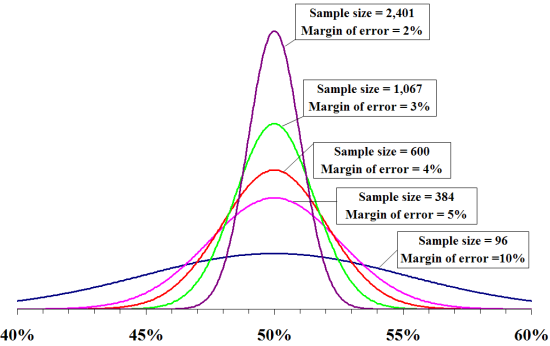
OK, maybe math wasn’t your favorite subject, but don’t be intimidated. To read the above, just note that the curve “bunches together” more with a lower margin of error. This just means there’s a much better chance your figures are accurate.
But what if there were 500 viable candidates and none were heavily favored? The top candidate gets 0.8%, the lowest 0.02%. With so many bunched together, even the 2% curve above leaves us uncertain how truly separated the candidates are. Therefore, you might need to increase the sample size.
Here's how this translates to a digital display or video-advertising program (mobile is a bit different).
Five Hundred Candidates or 3.6 Billion Value Combinations
In a typical RTB campaign, 50,000 impressions that ran on a random news website generated a 0.1% conversion rate versus a goal of 0.08% conversion rate. This equates 50 total conversions. However, if you break it down further, you see 48 of the 50 conversions occurred between 7 a.m. and 10 a.m. Within those 48, 35 occurred on a Monday. Within those 35, 27 were on Windows 7 operating-system (OS) machines. You can see how quickly this unfolds, and it could go on further by adding in more variables.
The key takeaway here is this random news website isn't necessarily a great site as a lone variable. It's good at certain times, on certain days, with certain other variables applied.
How many variables and outcomes do you need to take into account when examining a buy? The following are conservative values that actually hurt my case.
| Days of Week |
7
| |
| Hours of Day |
24
| |
| Browsers |
6
| |
| Devices |
3
| |
| OS |
4
| |
| Sites |
10,000
| |
| Ad Sizes |
3
| |
| Data Segments |
10
| |
| Creative Treatments |
1
| |
| Total Unique Combinations |
3,628,800,000
| |
That's right: More than 3 billion unique combinations can be taken into account – and this is conservative. It's probably more like 50,000 sites, 20 data segments, and so on, which would make the number much larger.
Being an advertising major and not formally trained in statistics, I consulted two professional statisticians. These gentlemen advised on some of the techniques below to ensure I followed best practices within their industry.
There are two ways to look at this: We can "project forward" for sample size, as in the earlier presidential poll example, or "look backward," since this is a scenario where we already have data, assuming the buy has already ran. When projecting forward, due to so many unique combinations, it’s likely the performance of millions of combinations will bunch up within 0.001% of each other. Going back to that sample size calculator, with an Internet population of 214 million, to get down to a 0.001% margin of error, your sample size now needs to be more than 209 million. That’s a lot to “sample” before knowing what performs and what doesn’t. But this really doesn’t feel right. So let’s “look backward” instead.
To look backward, let’s determine how many "observations" or impressions we need per unique combination of values to derive a statistically valid and confident decision. Per a whole lot of amazingly sleep-inducing Internet chat forums on the subject, there are some instances where 10 observations will suffice and other instances where 30 or 40 will be considered reasonable. Even if 10 observations or impressions are enough, are you running 36.2 billion impressions per flight? This certainly won’t work, so maybe it’s time to give up on the notion of understanding every unique, detailed combination.
Just Be Better Than a Human with Excel
Yes, the perfect algorithm should theoretically explore every combination within the variables. But the example above proves this too unlikely, and no algorithm is perfect. Conversely, we don’t need an algorithm that only looks at a single variable. A human could do that with the “sort” function in Excel. Going back to our random news website, let’s say the algorithm looks at just two variables at a time, such as site and data segment, browser and hour of day, or site and day of week. We could argue certain variables are more important than others, but we’re talking magic in a box here. Surely it can calculate any two variables at a time.
To do this, we need the total number of individual pairs among the values in these variables. Cutting the number of sites down to 1,000 to further prove the point, I’d love to tell you I know the formula to figure this out, but three minutes in Excel multiplying each column out gave me 59,284 unique pairings.
You’ll remember some stats folks suggesting 10 observations or impressions per combination would be enough. Would you optimize anything off of 10 impressions? Even 100? Since we’re trying to be more realistic but still conservative, we’ll use 1,000 impressions per combination of values. Now we’re up to 59,284,000 impressions needed to get good data across all two-value pairs. Use a more realistic threshold like 5,000 per combination, and we’re up to more than 295 million. How many of you are running this type of buy, with one vendor, in one flight?
Frequency
Rather than looking at all of the media variables mentioned above, it might be easier to pivot our viewpoint and look at users instead. This would suggest the algorithm is going to optimize against users and not the media variables like site, time of day and so on. To do so this, we need to look at frequency. Going back to the notion of “observations,” research shows us 10 is actually an OK number. We’ve looked at thousands of campaigns and seen that a monthly frequency of eight to 12 is needed before we see results diminish in efficiency. OK, time out: It’s common-sense gut-check time.
If you need roughly 10 impressions per user before you know whether or not to optimize that user in or out of the buy, you’ve also served that user enough impressions to make him or her convert if it was going to happen. No point in optimizing against that user now, you already know the outcome.
The 100 Millisecond Response
Moving away from statistics, let’s address the myth that “no human can make decisions within the 100 milliseconds we have to make an RTB decision.” That’s correct, but algorithms don’t, either.
The reality is most RTB-ecosystem participants cache their line items and, therefore, their bids, so they can respond within the 100 milliseconds and not be timed out. In order to cache these line items and bids, the algorithm has to work independently of the bidding, establish new line-item values in the system, and then allow the system to cache those. Even though they’re working independently, they theoretically could repopulate and recache thousands of times per second. Are they? Find out for yourself by asking your RTB rep. If proud of the answer, he or she will tell you.
Bringing It All Together
At this point you might ask what the point of an algorithm is at all. The point of this piece isn't to pick on any specific algorithm but to give color around the lunacy that says any digital media algorithm can work magic.
If you’re executing a $50,000 buy with a vendor, take some time and do the math before you decide to just leave it to people who say they have an algorithm. A good algorithm should be transparent, and the company’s work and limitations behind it should be as well. Companies should tell you when they can improve performance and when they can’t, when there simply isn’t enough data.
And they should be willing to give you the data if you would like to review it or make decisions yourself. If I looked like George Clooney and wanted to try to get a date, I wouldn't go out on the prowl with a bag over my head. Those who are confident in their product will show it off and answer your questions without a guarded response.
No comments:
Post a Comment